Example script
run_example.RmdLoad data
# Setup options
knitr::opts_chunk$set(echo = FALSE, warning = FALSE, message = FALSE)

# Clear environment
rm(list = ls())

# Load relevant libraries
library(modelLong)
##
## Attaching package: 'modelLong'## The following object is masked from 'package:graphics':
##
## plot## The following objects are masked from 'package:base':
##
## plot, summary##
## Attaching package: 'dplyr'## The following objects are masked from 'package:stats':
##
## filter, lag## The following objects are masked from 'package:base':
##
## intersect, setdiff, setequal, union
library(ggplot2)  # Data visualization

# Load example longitudinal data (must be of long format)
ortho <- read.csv("../data/ortho.csv")[-1]
ortho <- ortho %>%
  dplyr::mutate(Subject = as.factor(Subject)) %>%  # Make subject ID a factor
  dplyr::arrange(Subject)  # Arrange measures by subject
ortho_labelled <- ortho

# Rename variables for (pretty printing)
ortho_labelled <- ortho %>% dplyr::rename("Distance" = distance, "Age" = age)

# Preview data
ortho_labelled[sample(nrow(ortho_labelled), 5),]
## Subject Sex Distance Age
## 151 M15 Male 23.0 8
## 63 F11 Female 28.0 12
## 102 M06 Male 28.1 18
## 111 M08 Male 24.5 12
## 47 F08 Female 24.8 16Data Summary
Print a summary table of the orthodontist data.
| Variable |
Overall N = 1621 |
Sex
|
|
|---|---|---|---|
|
Female N = 661 |
Male N = 961 |
||
| Distance | 24.72 (22.50, 26.50) | 23.09 (21.50, 24.60) | 25.83 (23.50, 27.50) |
| Age | 13 (10, 16) | 13 (10, 16) | 13 (10, 16) |
| 1 Mean (Q1, Q3) | |||
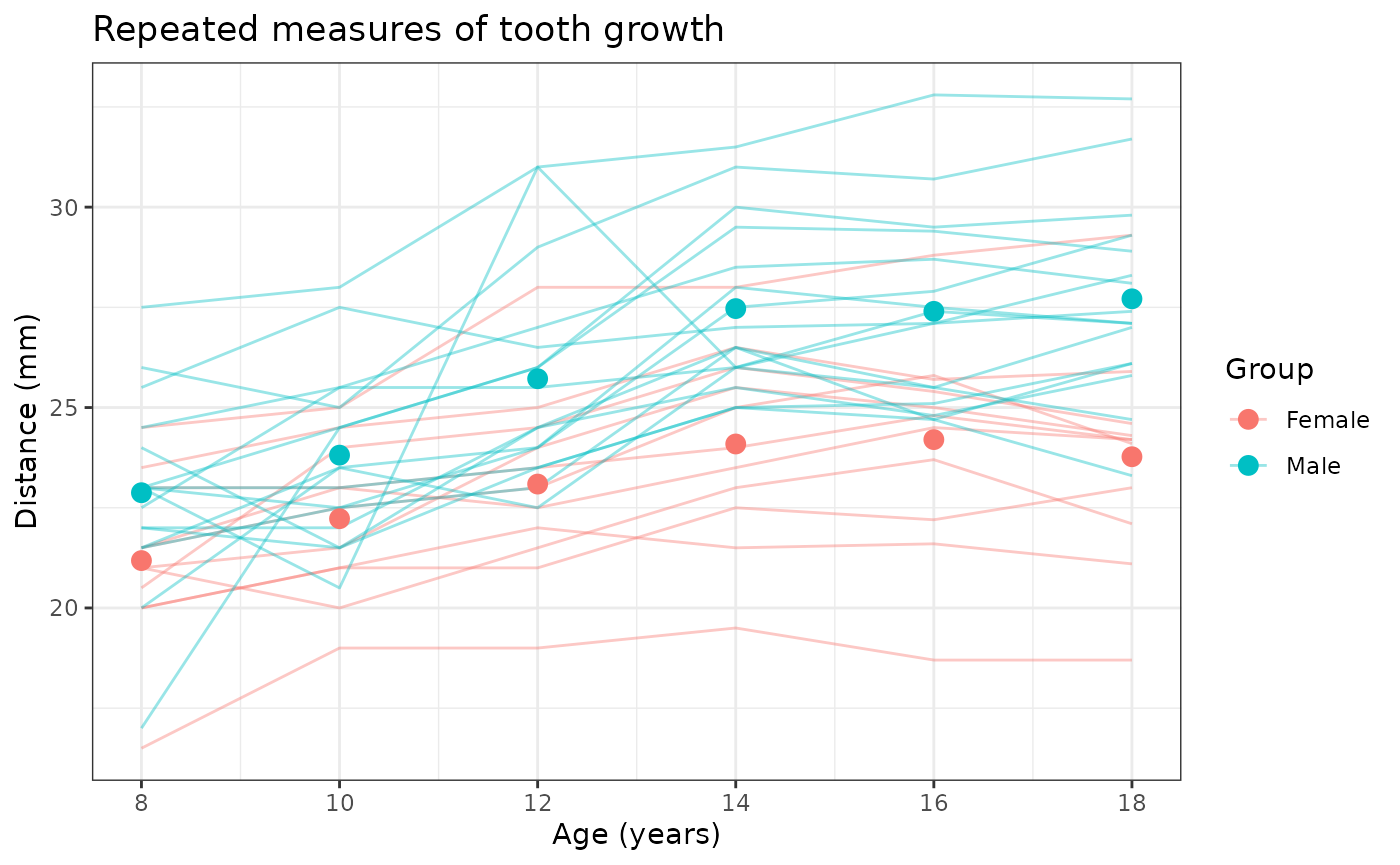
Marginal effects with GEE
Estimate the mean tooth growth associated with each sex population. This is suitable for a linear regression model fit with generalized estimating equations to account for the fact that our data is repeated measures over time; ignoring clusters and time may bias our estimates.
## (Intercept)         age     SexMale
##  17.5513997   0.4263492   2.7373106
##
## Call:
## geepack::geeglm(formula = formula, family = family, data = data,
## id = id, corstr = corstr)
##
## Coefficients:
## (Intercept) age SexMale
## 17.5513997 0.4263492 2.7373106
##
## Degrees of Freedom: 162 Total (i.e. Null); 159 Residual
##
## Scale Link: identity
## Estimated Scale Parameters: [1] 5.67822
##
## Correlation: Structure = independence
## Number of clusters: 27 Maximum cluster size: 6Conditional effects with GLMM
Estimate the mean tooth growth associated with each individual. This is well modeled by a linear regression model fit with mixed-effects to account each subject in the data.
## $Subject
##     (Intercept)       age  SexMale
## F01    16.44088 0.4263492 2.737311
## F02    17.96976 0.4263492 2.737311
## F03    18.53544 0.4263492 2.737311
## F04    19.46805 0.4263492 2.737311
## F05    17.64869 0.4263492 2.737311
## F06    16.19626 0.4263492 2.737311
## F07    18.06149 0.4263492 2.737311
## F08    18.15322 0.4263492 2.737311
## F09    15.81404 0.4263492 2.737311
## F10    13.39842 0.4263492 2.737311
## F11    21.37915 0.4263492 2.737311
## M01    20.36644 0.4263492 2.737311
## M02    15.82568 0.4263492 2.737311
## M03    17.43100 0.4263492 2.737311
## M04    18.47064 0.4263492 2.737311
## M05    16.39137 0.4263492 2.737311
## M06    18.66939 0.4263492 2.737311
## M07    15.71866 0.4263492 2.737311
## M08    16.19261 0.4263492 2.737311
## M09    17.55331 0.4263492 2.737311
## M10    21.91060 0.4263492 2.737311
## M11    16.13146 0.4263492 2.737311
## M12    17.03349 0.4263492 2.737311
## M13    17.59918 0.4263492 2.737311
## M14    17.09465 0.4263492 2.737311
## M15    18.74583 0.4263492 2.737311
## M16    15.68808 0.4263492 2.737311
##
## attr(,"class")
## [1] "coef.mer"
## Linear mixed model fit by REML ['lmerMod']
## Formula: distance ~ age + Sex + (1 | Subject)
## Data: data
## REML criterion at convergence: 648.4082
## Random effects:
## Groups Name Std.Dev.
## Subject (Intercept) 1.974
## Residual 1.452
## Number of obs: 162, groups: Subject, 27
## Fixed Effects:
## (Intercept) age SexMale
## 17.5514 0.4263 2.7373